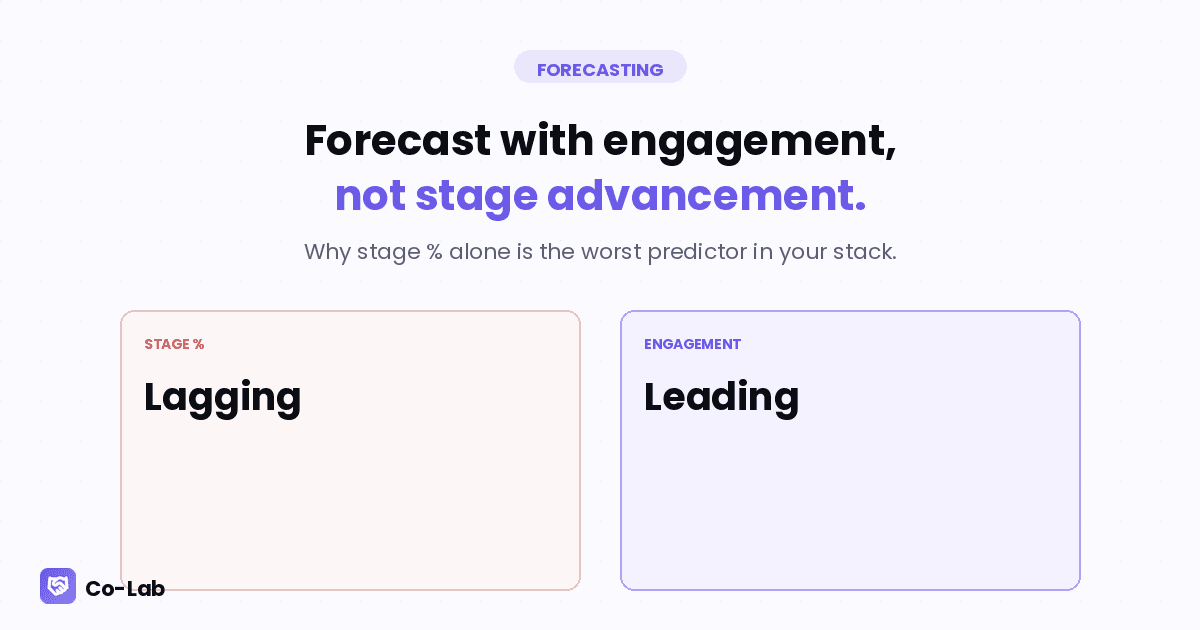
Forecasting With Engagement Data, Not Just Stage Advancement
Why stage % alone is the worst predictor in your forecast — and what to add instead.
If you ask a sales leader "how do you forecast?" you'll usually hear some variant of:
"We weight each deal by its stage probability. Stage 3 is 40% to close, stage 4 is 70%, stage 5 is 90%."
This is the most common forecasting model in B2B SaaS. It's also the least accurate.
Here's why it fails, and what to add to fix it.
The problem with stage-based forecasting
Three failure modes, in order of frequency:
1. Stage advancement is a seller-side action. A deal moves from stage 3 to stage 4 because the AE updated the field. The buyer didn't do anything. The probability of close didn't actually change. The CRM's number changed.
2. Stage probability is averaged across thousands of deals. Your stage-4 probability of 70% is an aggregate. The specific stage-4 deal you're looking at might be 20% (it's been stuck for 6 weeks, buyer's gone silent) or 95% (champion just forwarded to procurement). The average tells you neither.
3. Stage advancement lags actual deal state. A deal that's actually dead can sit in stage 4 for weeks before the AE faces it and demotes it. Your forecast carries dead deals at full weight.
What engagement data adds
Engagement data is buyer-side and real-time. It captures what the buyer actually did this week, not what the AE said about the deal.
The two engagement signals that improve forecast accuracy most:
1. Days since last buyer interaction. If the buyer hasn't opened anything in 14+ days, the deal isn't going to close this quarter regardless of stage. Demote it.
2. Spread of engagement. A stage-4 deal with 4 stakeholders actively engaging is a very different deal from a stage-4 deal where only the champion has interacted. The first is closing; the second is single-threaded and at-risk.
These two signals, layered on top of stage data, raise forecast accuracy 20-35% in the teams that adopt them.
The two-axis forecast model
Here's the simplest practical model that works:
X-axis: Stage (your existing CRM stages) Y-axis: Engagement (Hot / Building / Champion-only / Cold — see our reading buyer activity post)
A 4x4 grid. Each deal lands in one cell. Each cell has a different probability:
| Hot | Building | Champion-only | Cold | |
|---|---|---|---|---|
| Stage 5 (Negotiation) | 95% | 70% | 50% | 15% |
| Stage 4 (Proposal) | 80% | 55% | 35% | 10% |
| Stage 3 (Eval) | 60% | 40% | 25% | 5% |
| Stage 2 (Discovery) | 40% | 25% | 15% | 0% |
The probabilities are illustrative — calibrate to your own historical data. The structure is what matters: stage and engagement, multiplied.
The pattern this surfaces: a stage-5 deal that's "Cold" is 15%, not 90%. That deal would have been forecast at 90% with stage alone. The engagement signal corrects it.
What changes in the forecast review
Old forecast review: "What's the stage? Why did it move? What's next step?"
New forecast review: "What's the stage and what's engagement showing? Are those signals aligned or contradicting?"
The most useful question in the new model: "Which deals look healthy in CRM but cold in engagement?" Those are your hidden risks. Surface them, address them, or kill them.
Conversely: "Which deals look stuck in CRM but hot in engagement?" Those are deals where the rep should be pushing harder — the buyer is ready, the rep is being polite.
The cultural friction
This shift is harder than it sounds because it asks reps to admit when their gut was wrong.
A rep called a deal "best case" because their last call went well. The engagement data shows the buyer hasn't opened anything since. The model classifies it as Cold. The rep needs to demote their forecast.
Reps don't like this. They feel the model is overruling their judgment. (It is.)
Sales leaders who back the data over the gut see better forecast accuracy. Sales leaders who back the gut see surprises in the close-lost report.
The middle ground that works: flag the data-vs-gut conflicts in forecast review, force the rep to articulate why their gut should win. Sometimes the rep has signal the data doesn't see (the buyer's CFO mentioned approval at the offsite, the champion is on PTO, etc.). Document those. Most of the time, the data is right.
How to operationalize without rebuilding your CRM
You don't need to replace Salesforce or HubSpot. Add the engagement layer:
1. Use a deal-room tool that captures buyer engagement (Co-Lab, DocSend, etc. — the category is real beyond just us)
2. Pipe the high-signal events into your CRM as activity records. Every buyer pod open becomes a logged activity with a timestamp.
3. Build the 4x4 grid as a custom report. Most CRMs support this with a few custom fields (engagement score, days-since-last-buyer-action).
4. Use the grid in weekly forecast reviews. Sort by the deals where stage and engagement disagree. Discuss those first.
Setup time: a few hours of CRM admin work. Ongoing maintenance: trivial.
What this means for your team
If your team's forecast accuracy is below 75% at the deal level, you're flying without the buyer-side instrument panel.
Adding engagement data isn't a tooling project. It's a forecasting philosophy shift — from "what did the rep tell us" to "what did the buyer actually do."
The teams that make this shift report better forecast accuracy within a quarter and earlier visibility into at-risk deals (catching deals 14-21 days before they fall out of the quarter).
That's the actual value: not better numbers in the forecast, but earlier signal on the deals that need intervention.
Want engagement data piped into your CRM forecast? Co-Lab integrates with HubSpot and Salesforce. Free at colabapp.ai, code SALES for 3 months.
More from the blog
Keep reading.
Where Renewal Risk Actually Hides (Hint: The Handoff)
Why most churn is a handoff problem disguised as a renewal problem — and how to fix it.
Ramp New AEs in 14 Days, Not 90
What changes when your training material is just real pods from real deals.
The 2026 Sales Tools Audit: What to Cut, What to Keep
An honest framework for trimming a sales stack that's grown to 18 tools nobody fully uses.